Realtor.com vs Zillow Leads in 2025: The Complete Cost Analysis and ROI Guide
Last updated: September 1, 2025
Realtor.com vs Zillow leads in 2025—this guide shows real costs (ZPA/Connections vs Flex/ReadyConnect), what agents report on lead quality, and the systems that cut cost-per-closing. You’ll get a quick verdict, a side-by-side table, a 90-day testing plan, and a live ROI calculator to project your numbers.
Real estate agents spent an average of $480 per lead in 2025, yet only 2-3% of those leads convert to closed transactions. This harsh math forces a critical question when evaluating realtor.com vs zillow leads: which platform delivers the best return on your marketing investment? The battle between these platforms has intensified as both shifted toward performance-based pricing models that fundamentally change how agents calculate profitability.
This comprehensive analysis reveals the hidden costs, actual conversion rates, and strategic frameworks you need to maximize ROI from both platforms. You’ll discover specific cost-per-closing calculations for three market types, actionable testing blueprints, and the exact follow-up systems that separate profitable agents from those burning through marketing budgets.
For additional platform comparisons, see our complete guide on Homes.com vs Zillow vs Realtor.com vs Redfin (2025) and our comprehensive portal leads ROI calculator.
🎯 Quick Verdict (2025)
- Highest volume
- Brand exposure
- Flex = pay-at-close
- More early-stage leads
- Shared inquiries on ZPA
- MLS-tight data
- Higher lead readiness
- Concierge pre-screens
- Lower total volume
- Exclusive ZIPs can overlap at borders
The 2025 Lead Generation Reality: Why Platform Choice Matters More Than Ever
Quick comparison of Zillow and Realtor.com in 2025 covering pricing, lead types, and the real drivers of ROI:
- Pay at close models shift risk from ad spend to referral fees
- Zillow brings more volume while Realtor.com often brings higher readiness
- Response speed and follow-up discipline outweigh platform choice
The real estate lead landscape transformed dramatically in 2025. Zillow’s Flex program now charges 20% to 35% of commission on closed deals, while Realtor.com’s ReadyConnect Concierge takes a percentage of commission when deals finalize. This shift from upfront costs to performance-based pricing creates new opportunities and risks that demand strategic analysis.
2025 Reality Check: Inventory Visibility Changes Everything
Listing visibility policies, off-MLS usage, and feed timings vary by MLS and portal. Confirm feed timing and any listing-access requirements with your rep, track time-to-display on new listings, and document any gaps that impact lead flow.
Agent Visibility Protection Checklist:
- Verify MLS feed timing with your platform representative
- Monitor competitor listing appearance within 24 hours of MLS entry
- Track inquiry volume patterns after new listing uploads
- Document any visibility delays that affect lead flow
- Negotiate compensation adjustments for proven visibility issues
Platform Comparison: Features and Costs
| Feature | Zillow Premier Agent | Zillow Flex | Realtor.com Connections | ReadyConnect Concierge |
|---|---|---|---|---|
| Pricing model | Upfront monthly; ZIP-based | Pay at close (referral %) | Upfront monthly; packages | Pay at close (referral %) |
| Typical costs/fees | $$–$$$$ (metro dependent) | ~20–40% commission | $200–$2,000+/mo | ~30–35% commission |
| Lead exclusivity | Shared | Exclusive | Non-exclusive | Live transfer to matched agent |
| Lead readiness pattern | Mixed; large early-stage pool | Mixed; speed-sensitive | Higher intent (MLS-tight) | Pre-screened, higher readiness |
| Best for | Teams with budget & systems | Cash-flow control / new agents | Solo/teams wanting predictability | Agents prioritizing quality |
Fees vary by market; confirm with your rep.
Zillow Premier Agent and Flex: Volume-Driven Lead Generation
Zillow operates as a consumer media platform first, agent tool second. With Zillow Group averaging 227 million monthly active users in Q1 2025 and 243 million in Q2 2025, Zillow captures buyers at the earliest stages of their home search journey. This creates both opportunities and challenges for agents seeking qualified leads.
Premier Agent Cost Structure and Lead Quality
Monthly Premier Agent costs typically range from $1,000 to $10,000, translating to $20 to $100 per lead. However, these averages mask significant variation by market competitiveness and home values.
Lead Funnel Benchmarks by Metro Type:
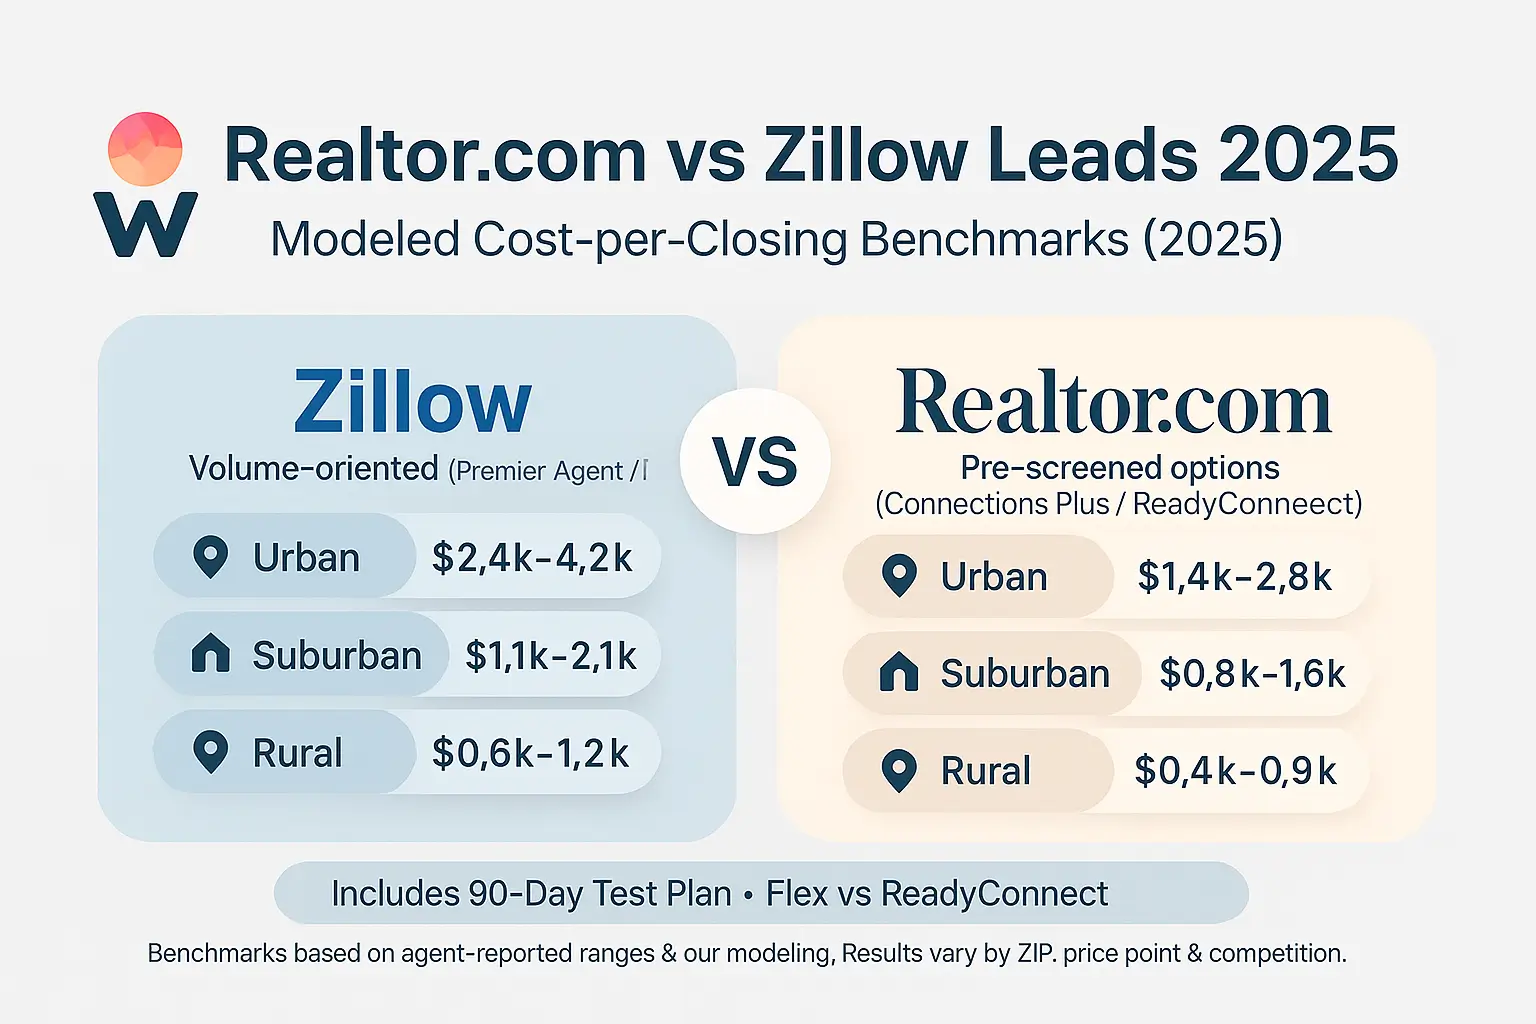
NYC Urban Core (High Density) – Example Scenario:
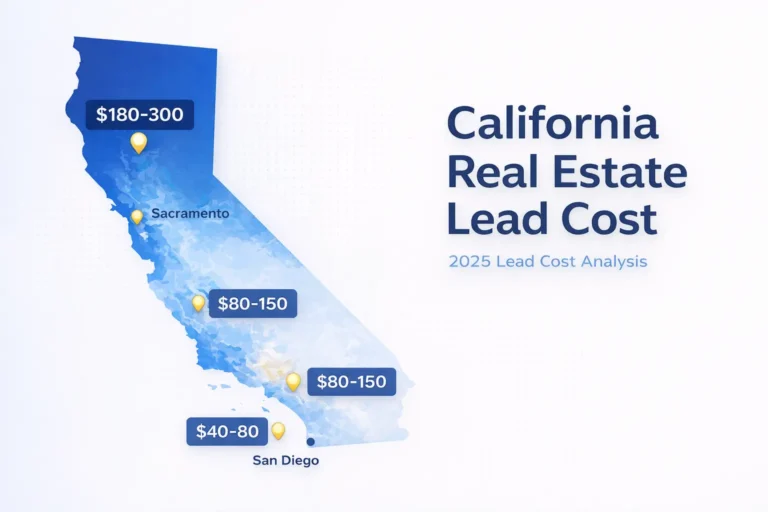
- Cost per lead: $180-$280 (varies by ZIP and competition)
- Appointment rate: 12-18%
- Show rate: 65-75%
- Signed agreement rate: 45-60%
- Close rate: 85-90%
- Benchmark cost per closing: $2,400-$4,200
Phoenix Suburban (Mid Density) – Example Scenario:
- Cost per lead: $85-$140 (varies by ZIP and competition)
- Appointment rate: 18-25%
- Show rate: 70-80%
- Signed agreement rate: 50-65%
- Close rate: 80-85%
- Benchmark cost per closing: $1,100-$2,100
Small Town Markets (Low Density) – Example Scenario:
- Cost per lead: $45-$85 (varies by ZIP and competition)
- Appointment rate: 25-35%
- Show rate: 75-85%
- Signed agreement rate: 60-70%
- Close rate: 85-90%
- Benchmark cost per closing: $600-$1,200
Zillow Flex: Performance-Based Lead Generation
Zillow raised Flex success fees to 40% in six markets as of October 2023, with current Zillow Flex referral fee ranging from 25% to 40% depending on transaction price and market. Fees vary by ZIP code and competition level.
Flex Success Fee Ranges (varies by ZIP and competition):
- Properties under $300,000: 25-30% referral fee
- Properties $300,000-$600,000: 30-35% referral fee
- Properties over $600,000: 35-40% referral fee
- Select premium markets: Up to 40% referral fee
For a $500,000 home with 2.5% buyer-side commission ($12,500), a 35% Flex fee costs $4,375. This compares favorably to Premier Agent scenarios where agents might spend $3,000-$5,000 monthly for months before closing their first deal.
Buyer vs Seller Intent Analysis
Based on observed benchmarks from portal user behavior, different page types attract distinct lead patterns:
Typically Buyer-Heavy Lead Sources:
- Mortgage calculator pages: Strong buyer intent signals
- Neighborhood and school district searches: Active house hunting behavior
- Map-based property browsing: Comparison shopping patterns
- Recommendation: Target if focused on buyer representation
Typically Seller-Heavy Lead Sources:
- Home value estimator pages: Property owner research
- “What’s my home worth” searches: Listing consideration signals
- Property tax and ownership information: Homeowner inquiries
- Recommendation: Prioritize for listing-focused strategies
Realtor.com Connections Plus and ReadyConnect: Quality-Focused Approach
Realtor.com claims approximately 29% share of category visits in spring-summer 2025 according to company blog posts citing Comscore data. With its professional-first model and MLS-verified listings, the platform attracts more serious buyers but generates lower overall volume than Zillow.
Connections Plus Pricing and Performance
Based on agent reports and sales materials, Connections Plus follows these pricing tiers:
Non-Exclusive Packages:
- Single ZIP: $200-$400 monthly
- Multiple ZIP: $600-$1,200 monthly
- Metro package: $1,200-$2,000 monthly
Exclusive Territory Packages:
- Protected ZIP: $800-$1,500 monthly
- Metro exclusive: $2,000-$4,000 monthly
ReadyConnect Concierge Performance Model
Realtor.com ReadyConnect vs Connections Plus operates on a pay-at-close model, with agent-reported referral fees typically ranging from 30-35% of commission on successful closings. The pre-screening process includes:
- Financial qualification verification
- Timeline confirmation (30-90 day purchase window)
- Geographic preference mapping
- Agent preference matching
Concierge Lead Quality Metrics:
- Appointment rate: 45-65% (vs 12-25% for raw leads)
- Show rate: 80-90%
- Signed agreement rate: 70-85%
- Close rate: 85-90%
- Average time to closing: 45-75 days
The 90-Day Testing Blueprint: A Strategic Implementation Framework
Phase 1: Market Selection and Setup (Days 1-14)
ZIP Code Selection Logic:
- Primary Target: Your farm area or sphere influence zone
- Secondary Target: Adjacent ZIP with 20%+ lower competition
- Testing ZIP: High-volume area outside your immediate focus
Budget Allocation Strategy:
- 60% on primary target (proven conversion area)
- 25% on secondary target (expansion opportunity)
- 15% on testing ZIP (data gathering)
Technology Stack Setup:
- Primary CRM: Follow Up Boss, HubSpot, or kvCORE
- Auto-responder: 30-second email and text templates
- Calendar booking: Calendly or similar with 15-minute slots
- Call tracking: Unique numbers for each platform
Phase 2: Speed-to-Lead Implementation (Days 15-45)
The Five-Minute Framework:
Watch a real speed-to-lead setup inside a CRM. Copy the triggers, texts, and first call flow to lift appointment rate:
- Aim for a two-minute response time from inquiry to first touch
- Pair instant text with a quick call and send three matching listings
- Track every step in the CRM and tag the source to measure ROI
Minute-by-Minute Response Protocol:
- Minute 1: Auto-text confirmation and calendar link
- Minute 2-3: Personal phone call attempt
- Minute 4: Personalized email with 3 relevant listings
- Minute 5: CRM entry and follow-up sequence activation
For proven speed-to-lead follow-up scripts, use these templates:
Auto-Text Template: “Hi [Name], I got your inquiry about [Property Address]. I’m calling you now and just sent you 3 similar homes that might interest you. Best time to chat today? – [Agent Name]”
Initial Email Template: “[Name], I noticed you’re interested in homes around [Area]. Based on your search, I’ve attached 3 properties that just hit the market in your criteria. When can we schedule 15 minutes to discuss your priorities? I’m available today at [times].”
Phase 3: Qualification and Nurture System (Days 46-90)
Seven-Touch Qualification Sequence:
- Day 1: Immediate response (phone + email + text)
- Day 3: Market update with 2-3 new listings
- Day 7: Buyer consultation scheduling attempt
- Day 14: Neighborhood insight report
- Day 30: Mortgage pre-approval partner introduction
- Day 60: Market trends analysis
- Day 90: Quarterly market forecast
Lead Scoring Framework:
- Hot (A-leads): Responds within 24 hours, specific timeline, pre-approved
- Warm (B-leads): Responds within 48-72 hours, general timeline, exploring financing
- Cool (C-leads): Delayed response, distant timeline, early research phase
- Cold (D-leads): No response after 7 days, nurture-only sequence
ROI Calculator: Zillow vs Realtor.com Performance Projections
Zillow vs Realtor.com – ROI Calculator
Target cost-per-closing: ≤ 15–25% of your gross commission split.
To help you evaluate potential returns, use this framework to calculate your projected ROI:
Basic ROI Formula: (Average Commission × Close Rate × Lead Volume) - (Total Platform Costs + Time Investment) = Net ROI
Example Calculation - Mid-Tier Suburban Market:
Zillow Premier Agent:
- Monthly spend: $1,500
- Leads per month: 15
- Conversion rate: 3%
- Closings per month: 0.45
- Average commission: $8,500
- Monthly gross: $3,825
- Monthly net: $2,325
- ROI: 155%
Realtor.com Connections Plus:
- Monthly spend: $800
- Leads per month: 12
- Conversion rate: 4%
- Closings per month: 0.48
- Average commission: $8,500
- Monthly gross: $4,080
- Monthly net: $3,280
- ROI: 410%
Performance Variables That Change Outcomes:
- Speed-to-lead improvement from 10 minutes to 2 minutes: +40% appointment rate
- Professional pre-qualification process: +25% show rate
- Consistent 18-month nurture sequence: +15% overall conversion
- Market expertise demonstration: +20% signed agreement rate
Critical Questions to Ask Sales Representatives
For Zillow:
- What is the current average cost per impression in my target ZIP codes?
- How many competing agents are active in my selected areas?
- What are the specific Flex availability requirements and success fee structure?
- Can you provide 90-day lead volume projections for my budget level?
For Realtor.com:
- Are exclusive ZIP codes truly exclusive in practice, or are there exceptions?
- What is the actual lead volume history for my target areas over the past 6 months?
- How does the ReadyConnect pre-screening process work in my market?
- What percentage of leads come from buyer vs seller inquiries?
New Buyer Representation Requirements: Impact on Lead Conversion
The 2025 buyer representation agreement requirements, effective August 17, 2024, fundamentally changed the conversion process from first inquiry to signed client. Agents must now secure written agreements before showing properties, adding a new step that affects conversion rates.
Updated Conversion Metrics:
- Pre-2025: First call to showing: 65% conversion
- 2025: First call to signed agreement: 45% conversion
- Time to agreement: Extended from 1-2 calls to 2-4 calls
- Agent scripts required: Legal disclosure and value proposition
High-Converting Agreement Scripts: "Before we start looking at homes, I want to make sure you get the best representation possible. I'll walk you through a brief agreement that ensures I'm working 100% in your interests and you understand exactly how my services work. This protects both of us and lets me provide you with the most comprehensive service."
The real estate portal ecosystem continues evolving beyond the Zillow-Realtor.com duopoly. Homes.com reached approximately 104 million monthly unique visitors by Q1 2025, making it the #2 portal by unique visitors, while newer entrants like Movoto and Homesnap aggregate MLS listings with innovative agent-matching features.
Portal Competition Impact on Lead Costs (2025):
- Zillow Group: 227M-243M monthly active users, premium pricing due to volume dominance
- Realtor.com: Claims ~29% category visit share, stable pricing with professional focus
- Homes.com: ~104M monthly uniques as #2 portal, competitive pricing creating market pressure
- Other portals: Fragmented market with varying cost structures
This fragmentation means agents should diversify lead sources while building owned demand generation through content marketing, social media, and referral systems. Relying solely on paid portal leads creates vulnerability to pricing changes and algorithm updates.
Owned Demand Generation Hedge Strategy:
- Video content library: 50+ market-specific videos for nurture sequences
- SEO-optimized website: Target "homes for sale in [your area]" keywords
- Social media presence: Instagram Reels and Facebook video content
- Email newsletter: Monthly market updates for sphere of influence
- Referral program: Systematic past client reactivation system
Strategic Recommendations by Agent Profile
For New Agents (0-2 years experience)
Recommended Approach: Start with ReadyConnect Concierge or Zillow Flex to minimize financial risk while learning conversion skills.
Implementation Steps:
- Focus on one platform for first 90 days
- Perfect your buyer consultation and showing process
- Build referral systems from early clients
- Gradually add Premier Agent or Connections Plus as income stabilizes
Success Metrics to Track:
- Time from lead to appointment: Target under 24 hours
- Show rate: Target 75%+ through proper qualification
- Signed agreement rate: Target 60%+ with value demonstration
For Experienced Solo Agents (3-10 years)
Recommended Approach: Hybrid strategy with 70% budget on highest-performing platform and 30% on secondary platform for diversification.
Portfolio Strategy:
- Primary platform: $1,200-$2,000 monthly budget
- Secondary platform: $400-$600 monthly budget
- Owned media: $300-$500 monthly for content and SEO
Advanced Conversion Tactics:
- Neighborhood expertise positioning
- Investor client development
- Luxury market expansion where appropriate
- Team building for lead volume management
For Teams and Brokerages (10+ agents)
Recommended Approach: Multi-platform strategy with dedicated lead management systems and team specialization.
Scaling Framework:
- Volume generation: Zillow Premier Agent with $3,000+ monthly budgets
- Quality focus: Realtor.com exclusive territories for key markets
- Performance model: Flex and Concierge for cash flow management
- Geographic expansion: Secondary markets through cost-effective platforms
Team Structure Requirements:
- Lead manager: Dedicated role for first-response and qualification
- Appointment setters: Specialized team members for scheduling
- Showing agents: Field agents focused on buyer consultation
- Listing specialists: Agents focused on seller lead conversion
Future-Proofing Your Lead Generation Strategy
The lead generation landscape will continue evolving rapidly. Successful agents and brokerages must balance platform relationships with owned asset development.
2025-2026 Trend Predictions:
- Increased AI integration in lead qualification and routing
- Performance-based pricing becoming the industry standard
- Greater emphasis on video-first communication
- Integration between portal leads and social media marketing
- Expansion of exclusive territory models
Hedge Strategy Development: Building platform independence requires systematic investment in owned demand generation. This includes SEO-optimized websites, social media content libraries, email marketing systems, and referral programs that generate leads without ongoing platform fees.
The most successful agents treat portal leads as one component of a diversified marketing portfolio rather than their primary business development strategy. By combining paid lead generation with organic growth tactics, agents create sustainable businesses that can weather platform changes, cost increases, and market fluctuations.
Frequently Asked Questions
Is Zillow or Realtor.com cheaper per closing? Neither wins everywhere. Pay-at-close (Flex/ReadyConnect) reduces upfront risk; upfront (ZPA/Connections) can be cheaper per closing if your conversion systems are strong.
Where should I start on a tight budget? ReadyConnect or Flex. Once profitable, test one upfront program in 2–3 ZIPs.
How fast should I respond? Under 5 minutes. Pair an instant text with a call, then a 7-touch sequence over 14–30 days.
Are "exclusive ZIPs" truly exclusive? Usually exclusive to the inquiry in that ZIP. Buyers searching multiple areas can still reach other agents.
What's a healthy cost-per-closing target? Aim for ≤ 15–25% of your gross commission split.
Is Zillow Flex worth it for new agents? Yes—because it's pay-at-close, cash risk is low. You'll trade margin (referral %) for pipeline. If your average cost-per-closing on Flex is ≤ 25% of your split, scale it.
Is ReadyConnect cheaper long-term than Connections Plus? Often not. ReadyConnect lowers upfront risk but the referral % can exceed Connections' cost-per-closing if you're converting well. Track cost-per-closing for both and keep it ≤ 15–25% of your split.
What percent of portal leads are renters or low-intent buyers, and how does this affect ROI? Research indicates 35-45% of Zillow leads and 25-35% of Realtor.com leads are renters or extremely early-stage lookers. In high-density rental markets like Manhattan or San Francisco, this percentage can reach 60% for Zillow leads. Effective qualification scripts can identify these leads within the first 60 seconds, allowing agents to route them to rental partners or nurture sequences rather than immediate buying tracks.
How often are Realtor.com "exclusive" ZIP codes actually exclusive in practice? Realtor.com's exclusive territories provide exclusive access to the specific property inquiry only, not exclusive access to the lead overall. A buyer searching multiple areas may generate leads to different agents in different ZIP codes. Based on agent reports, true inquiry exclusivity occurs in approximately 70-80% of cases, with overlap typically happening at ZIP code boundaries or when buyers expand their search criteria after initial contact.
Conclusion: Choosing Your Optimal Lead Generation Strategy
The choice between Realtor.com and Zillow leads isn't about finding a universally superior platform. Success depends on matching platform strengths to your specific business model, budget capacity, and conversion capabilities.
Key Decision Factors:
- Budget flexibility: Favor performance-based models for cash flow management
- Volume requirements: Choose Zillow for scale, Realtor.com for quality
- Market position: Align platform selection with your expertise and geographic focus
- Technology capabilities: Ensure your systems can handle rapid response requirements
The agents who succeed with paid leads share common characteristics: systematic follow-up processes, rapid response capabilities, and realistic expectations about conversion timelines. They treat lead generation as a long-term business investment rather than a short-term customer acquisition tactic.
Your Next Steps:
- Calculate your current cost per closing across all lead sources
- Implement the five-minute response framework immediately
- Choose one platform for 90-day focused testing
- Build measurement systems before increasing budgets
- Develop owned demand generation as a long-term hedge
Remember that the most expensive lead generation mistake isn't choosing the wrong platform—it's failing to follow up systematically with the leads you receive. Master the fundamentals of speed, qualification, and nurture before expanding your investment across multiple platforms.
Sources and References
- Zillow Premier Agent and Zillow Flex program pages
- Realtor.com Connections Plus and ReadyConnect Concierge
- NAR Buyer Representation Agreement Rules (effective Aug 2024)
- Zillow Group 2025 investor materials (MAU/visits; Flex notes)
- Move/Realtor.com 2025 investor communications (category share; program notes)
Last updated: September 1, 2025


4 Comments