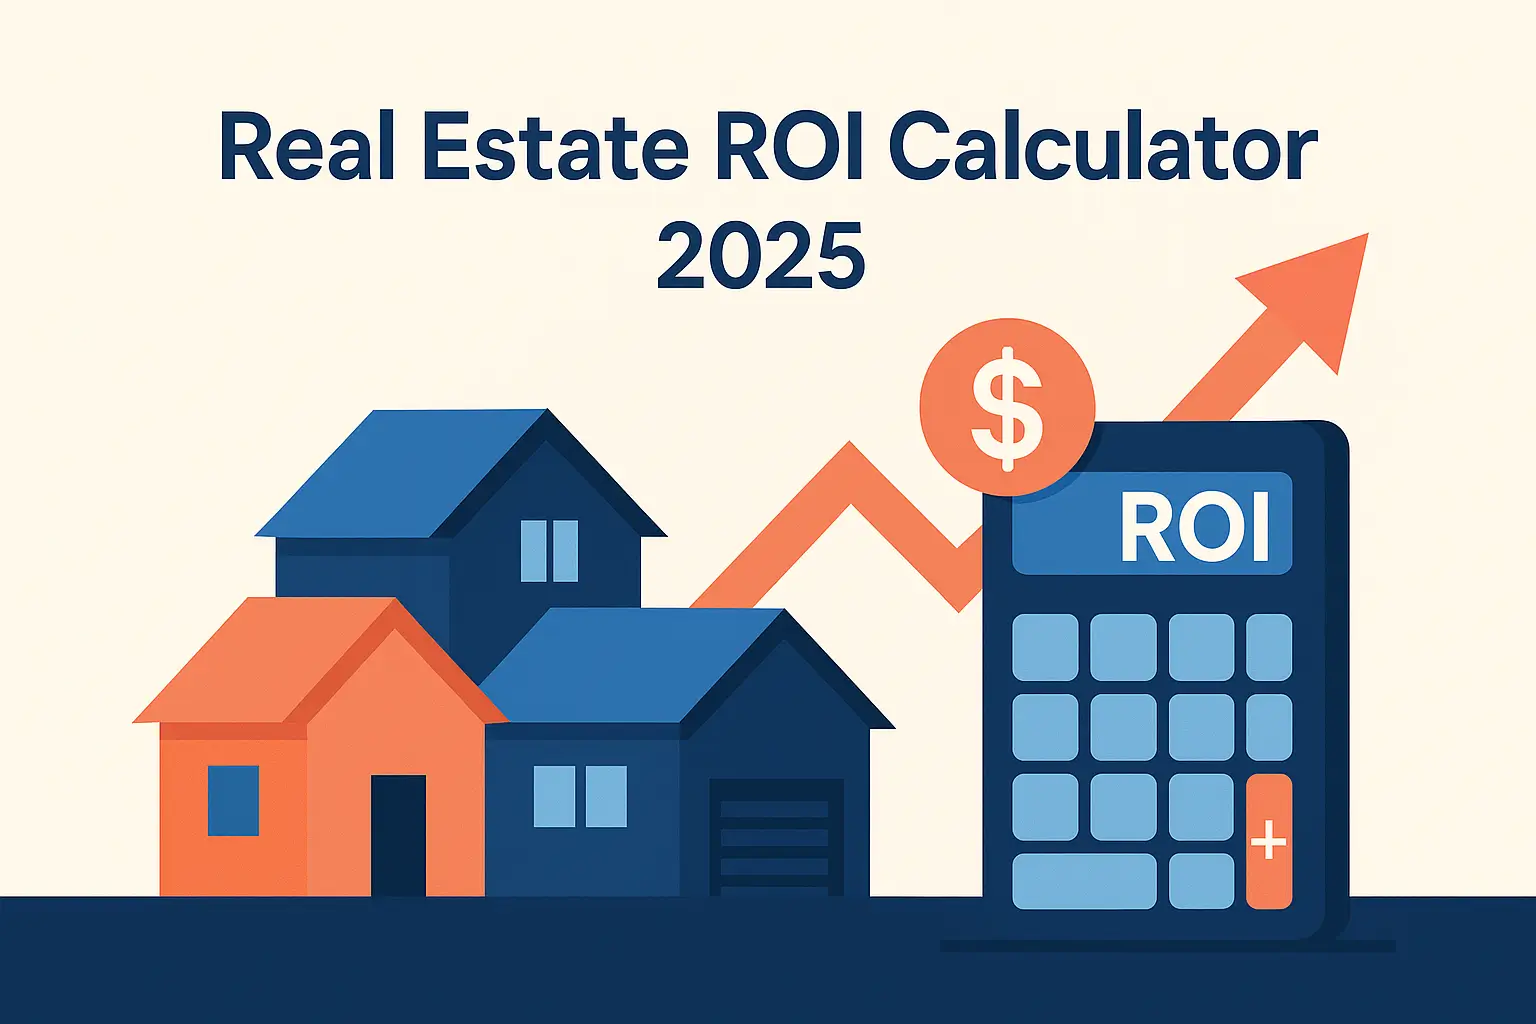
The Complete Real Estate Lead Generation ROI Calculator: Master Your Marketing Math in 2025
Last updated: August 16, 2025
Your real estate lead generation budget could be bleeding money right now, and you might not even know it. While you’re focused on getting more leads, the agents who actually build wealth focus on something different: cost per profitable closing.
Here’s what separates successful real estate professionals from those who struggle: they measure what matters. They know their exact cost per appointment, cost per closing, and profit per closing for every marketing channel. This knowledge lets them scale what works and kill what doesn’t.
This guide will show you how to calculate your real estate lead generation ROI with precision, compare channels like Zillow and Realtor.com side by side, and build a systematic approach to marketing that actually grows your business. You’ll walk away with a working calculator, benchmark data from successful agents, and a 30-day optimization plan you can start today.
Working Calculator: Compare Your Channels Side by Side
🏠 Real Estate Lead Generation ROI Calculator
Calculate your true marketing ROI and optimize your lead generation strategy
📊 Your Marketing Metrics
📈 Your ROI Results
💡 Optimization Tips Based on Your Results
Why Most Real Estate Lead Generation ROI Calculations Are Wrong
Most agents make the same mistake when evaluating their marketing: they stop at cost per lead (CPL). This creates a dangerous blind spot that can destroy your profitability.
Consider this scenario: Agent A pays $20 per lead from Zillow. Agent B pays $40 per lead from Google Ads. Who’s winning? Without knowing the rest of the funnel, you can’t tell. If Agent A converts 5% of leads to closings and Agent B converts 15%, Agent B’s “expensive” leads actually cost $267 per closing while Agent A’s “cheap” leads cost $400 per closing.
The problem gets worse when you factor in commission splits and gross commission per closing. A $20 lead that generates a $8,000 commission closing nets you far less profit than a $40 lead that generates a $15,000 commission closing.
This is why you need to track the complete funnel from initial lead to final profit.
The Real Estate Lead Generation ROI Calculator: Core Metrics That Matter
Your marketing ROI comes down to seven key inputs that work together to determine your profitability:
Monthly Spend: Your total marketing budget for a specific channel or campaign.
Cost Per Lead (CPL): How much you pay for each lead. This varies dramatically by source, with shared portal leads often running $15-35 while exclusive portal leads can cost $50-100 or more.
Contact Rate: The percentage of leads you actually reach. Industry benchmarks suggest 25-65% depending on response time and follow-up systems.
Appointment Rate: The percentage of contacted leads who agree to meet. Typical ranges run 15-40% based on lead quality and your conversion skills.
Close Rate: The percentage of appointments that become closings. This varies from 8-30% depending on market conditions and your sales process.
Gross Commission Income (GCI): Your total commission before splits. This depends on your market’s average home prices and commission structures.
Your Split: The percentage you keep after paying your brokerage. This might range from 50% for new agents to 95% for top producers.
These metrics combine to create your most important calculations:
- Cost Per Appointment (CPA): Monthly spend ÷ total appointments
- Cost Per Closing: Monthly spend ÷ total closings
- Profit Per Closing: (GCI × your split) – cost per closing
Step-by-Step: How to Calculate Your Real Estate Lead Generation ROI
Let’s work through the math with a real example. Assume you’re spending $1,500 monthly on portal leads with the following metrics:
- CPL: $30
- Contact rate: 35%
- Appointment rate from contacts: 30%
- Close rate from appointments: 20%
- GCI: $12,000
- Your split: 70%
Step 1: Calculate lead volume Leads = $1,500 ÷ $30 = 50 leads per month
Step 2: Calculate contacts Contacts = 50 leads × 35% = 17.5 contacts
Step 3: Calculate appointments Appointments = 17.5 contacts × 30% = 5.25 appointments
Step 4: Calculate closings Closings = 5.25 appointments × 20% = 1.05 closings
Step 5: Calculate cost per appointment CPA = $1,500 ÷ 5.25 = $286 per appointment
Step 6: Calculate cost per closing Cost per closing = $1,500 ÷ 1.05 = $1,429
Step 7: Calculate profit per closing Profit per closing = ($12,000 × 70%) – $1,429 = $6,971
This example shows a profitable channel where one closing more than covers your monthly spend while leaving substantial profit margin.
Channel-by-Channel Benchmarks: What to Expect from Each Lead Source
Different lead sources perform differently across your funnel. Here’s what successful agents typically see:
Portal Leads (Zillow, Realtor.com, Homes.com)
Shared leads:
- Contact rate: 25-40%
- Appointment rate from contacts: 20-35%
- Close rate from appointments: 10-25%
- Key factor: Response time under 5 minutes dramatically improves contact rates
Exclusive leads:
- Contact rate: 35-55%
- Appointment rate from contacts: 25-40%
- Close rate from appointments: 15-30%
- Trade-off: Higher CPL but often better cost per closing
Pay-Per-Click (PPC) Search Ads
- Contact rate: 20-35%
- Appointment rate from contacts: 15-30%
- Close rate from appointments: 8-20%
- Key factor: Keyword intent drives lead quality. “Homes for sale near me” typically converts better than broad terms.
Google Local Services Ads
- Contact rate: 40-65%
- Appointment rate from contacts: 20-35%
- Close rate from appointments: 10-25%
- Advantage: Phone calls indicate higher intent, but require strong phone scripts
These ranges vary by market, price point, and your systems. Start with these benchmarks, then replace them with your actual data after 30-60 days of tracking.
The CPPC Ladder: Your North Star for Optimization
Think of your funnel as a ladder where each rung affects your Cost Per Profitable Closing (CPPC). The rungs are:
- CPL (Cost Per Lead)
- Contact Rate
- Appointment Rate
- Close Rate
- Commission Amount
- Split Percentage
Here’s the key insight: improving an earlier rung typically has more impact than improving a later one. A 10-point improvement in contact rate often affects your CPPC more than a $5 reduction in CPL.
This is why successful agents focus heavily on response time, follow-up systems, and phone skills rather than just hunting for cheaper leads.
How to use this calculator:
- Enter your actual numbers for each metric (or use the defaults to start)
- Click “Calculate ROI” to see your results instantly
- Test different scenarios by changing the inputs
- Compare multiple channels by running separate calculations
Key outputs explained:
- Leads generated: Total leads your budget will buy
- Cost per appointment (CPA): What you pay for each booked appointment
- Cost per closing: Your marketing cost per successful transaction
- Profit per closing: Your actual profit after splits and marketing costs
Run these numbers for Zillow, Realtor.com, Google Ads, or any channel you’re considering. The channel with the best profit per closing wins, regardless of CPL.
Common Myths That Destroy Real Estate Marketing ROI
Myth 1: The lowest CPL always wins Reality: Appointment rate and close rate matter more than small CPL differences. A $50 lead that converts at 25% beats a $25 lead that converts at 10%.
Myth 2: Shared leads never work Reality: With sub-5-minute response times and systematic follow-up, shared leads can deliver better ROI than exclusive leads in many markets.
Myth 3: More leads beat better systems Reality: One extra appointment per 100 leads often generates more profit than 20 extra leads with the same conversion rates.
Myth 4: Portal leads don’t convert Research from multiple MLS systems shows that agents with strong follow-up systems convert portal leads at rates comparable to referrals when measured over 6-month periods.
Myth 5: You need a huge budget to compete Many successful agents build profitable businesses with $1,000-2,000 monthly marketing budgets by focusing on conversion optimization rather than lead volume.
30-Day Lead Generation ROI Optimization Plan
Week 1: Establish Your Baseline
- Set targets for cost per appointment and cost per closing
- Install instant lead alerts on phone and desktop
- Log current numbers in your CRM
- Create tracking systems for each lead source
Week 2: Optimize Response Time
- Enforce 5-minute response rule for all leads
- Create short text templates for immediate acknowledgment
- Set up one-minute video reply system
- Tag every lead by source in your CRM
Week 3: Improve Contact and Appointment Rates
- Add callback windows for missed contacts
- Implement SMS follow-up sequences
- Focus on single clear asks for appointments
- Test one variable at a time to measure impact
Week 4: Analyze and Optimize
- Run all channels through your ROI calculator
- Pause worst-performing sources
- Double budget on best cost-per-closing channels
- Replace benchmark ranges with your actual data
Advanced Strategies: Beyond Basic ROI Calculation
Geographic Optimization
Your ROI varies by location within your market. Track performance by zip code or neighborhood to identify your most profitable areas. Some agents find their cost per closing drops 30-40% when they focus on specific geographic zones.
Seasonal Adjustments
Lead quality and conversion rates change throughout the year. Track your metrics monthly to identify patterns. Many markets see improved conversion rates in spring/summer but higher CPLs due to increased competition.
Follow-Up Sequence Optimization
Your follow-up system affects every metric after CPL. Successful agents often use 7-touch sequences across calls, texts, emails, and video messages. Keep messages short, helpful, and focused on the prospect’s timeline rather than your need to close.
Channel Stacking Strategy
Instead of relying on one lead source, consider combining complementary channels. For example, retarget website visitors from your SEO efforts with Google Ads, or use Facebook ads to nurture leads who didn’t convert from portal sources initially.
Technology Tools That Improve Your ROI Metrics
CRM Systems
Your CRM should track lead source, contact attempts, appointment dates, and closing outcomes. Popular choices include Chime, Follow Up Boss, and KvCORE, each offering different strengths in lead management and ROI tracking.
Response Time Tools
Consider tools like Chime, BoomTown, or custom solutions that provide instant lead notifications via text, email, and phone calls. The faster your response, the higher your contact rates across all channels.
Communication Platforms
Text messaging platforms like BombBomb for video messages, Mailchimp for email sequences, or integrated solutions within your CRM can significantly improve your appointment rates from initial contacts.
Legal and Compliance Considerations for Lead Generation ROI
Lead Source Disclosure
Some states require disclosure of how you obtained a prospect’s contact information. Factor compliance costs and processes into your ROI calculations, especially for purchased lead programs.
Do Not Call Regulations
Ensure your calling practices comply with federal and state Do Not Call requirements. Violations can result in significant fines that destroy your marketing ROI.
Data Privacy
With increasing privacy regulations, factor in the costs of compliant data handling, especially if you’re using customer data for retargeting or long-term nurture campaigns.
Frequently Asked Questions
What is cost per appointment (CPA) in real estate?
Cost per appointment (CPA) is your total marketing spend divided by the number of booked appointments from that spend. It shows exactly how much you pay to sit down with a potential client. A good CPA varies by market but typically ranges from $200-500 for most channels.
How do I calculate cost per closing for my marketing channels?
Divide your total monthly marketing spend by the number of closings that come from that spend. For example, if you spend $2,000 and close 1.5 transactions, your cost per closing is $1,333. The calculator handles this automatically once you enter your funnel conversion rates.
What’s a good CPL for portal leads like Zillow and Realtor.com?
CPL varies significantly by market, season, and lead type. Shared portal leads typically cost $15-50, while exclusive leads can range from $50-150 or more. Focus on cost per closing rather than CPL alone, as higher-priced exclusive leads often deliver better overall ROI.
How many follow-up touches should I plan for new leads?
Most successful agents use a 7-touch follow-up sequence spanning 30-45 days. This typically includes immediate response (under 5 minutes), follow-up call within 24 hours, and a mix of calls, texts, emails, and video messages. Keep each touch brief and value-focused.
How should I compare Zillow, Realtor.com, and Homes.com for ROI?
Run each source through the same ROI calculator using your actual conversion rates. Enter your CPL, contact rate, appointment rate, and close rate for each platform. Compare them based on cost per closing and profit per closing, not just cost per lead.
What if my CPL increases during a campaign?
First, check if your contact and appointment rates remain stable. If conversion rates hold steady, higher CPL might still be profitable. If all metrics decline simultaneously, pause the campaign and review your targeting, ad creative, or landing pages before restarting.
Should I focus on buyer leads or seller leads for better ROI?
This depends on your market and skills. Listing leads typically offer higher GCI per transaction but may require different conversion approaches and longer sales cycles. Use the calculator with separate inputs for buyer and seller funnels to compare ROI in your specific market.
How do I account for long sales cycles in my ROI calculations?
Track leads by the month they were generated, not the month they closed. This gives you accurate ROI data for each marketing channel. Many agents use 6-month attribution windows to account for longer nurture periods, especially in higher-priced markets.
Can I use this calculator for rental or commercial real estate leads?
Yes, but adjust your inputs accordingly. Commercial deals typically have longer sales cycles, higher commission amounts, and different conversion patterns. Rental leads often have faster cycles but lower commission amounts. The fundamental math remains the same.
How often should I recalculate my marketing ROI?
Review your numbers monthly for budget allocation decisions and weekly for tactical adjustments. Your conversion rates will improve over time as you refine your systems, so regular recalculation ensures you’re making decisions based on current performance.
What’s the biggest mistake agents make with ROI calculations?
The biggest mistake is optimizing for cost per lead instead of cost per closing or profit per closing. Many agents chase cheap leads that never convert instead of focusing on higher-quality leads that cost more upfront but deliver better overall ROI.
How do I improve my appointment rate from contacts?
Focus on three key areas: timing (call within 5 minutes), preparation (research the lead beforehand), and simplicity (make one clear ask for the appointment). Avoid presenting multiple options or overwhelming prospects with information during the initial contact.
Conclusion: Turn Your Marketing Math Into Profitable Growth
Your real estate business lives or dies by the numbers in your marketing funnel. The difference between agents who build wealth and those who struggle comes down to measuring what matters: cost per closing and profit per closing.
Use the calculator and benchmarks in this guide to evaluate every marketing channel with precision. Start with the 30-day optimization plan to establish your baseline, then systematically improve each step in your funnel.
Remember: a lower CPL means nothing if it doesn’t improve your cost per profitable closing. Focus on the metrics that directly impact your bottom line, and you’ll build a marketing system that scales profitably.
Next Steps:
- Calculate your current ROI for each marketing channel
- Identify your biggest opportunity for improvement (usually contact rate or appointment rate)
- Implement one optimization from the 30-day plan this week
- Track your progress and adjust based on actual results
The agents who master their marketing math in 2025 will dominate their markets while others guess their way to mediocrity. Start measuring today.




2 Comments